Skip to content

Daniel Crawford's Data Blog

Tips for performant database designs

Menu
  • Home
  • Blog
  • Resources
  • About
  • Contact
Menu

Synapse Dedicated SQL Pool Execution Plans

Posted on August 4, 2022August 12, 2022 by Daniel Crawford

Synapse execution plans are specifically for distributed SQL (DSQL) and are not the same as SQL Server execution plans.  SQL Server execution plans show the types of join patterns (hash, nested, loop), bookmark lookups, sorts, etc…  Whereas Synapse execution plans show you how data must move between the different distributions of a Synapse Dedicated SQL Pool to co-mingle data and complete a query. 

A DSQL execution plan is a serial task list which coordinates steps that make calls to each of the 60 distributions which have their own SQL plans.  When performance tuning Synapse Dedicated SQL Pools the number one goal is to limit data movement between distributions.  Data movement is usually the most costly task in a DSQL plan and therefore the easiest place to make a big performance impact fast.  The first step to reviewing the execution plan is to get the execution plan for which there are three methods:

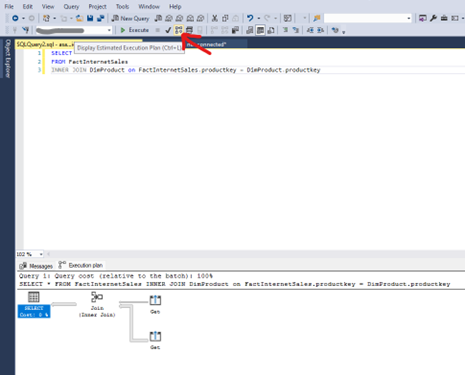
  1. In SQL Server Management Studio use “Display Estimated Execution Plan” – this is the same as the old SQL methodology of showing the execution plan but for Synapse it shows the distributed SQL plan.

  1. You can use the keyword “EXPLAIN” before any select statement to show you all of the steps, the fields that datasets are redistributed on, and the estimated cost of each step. 

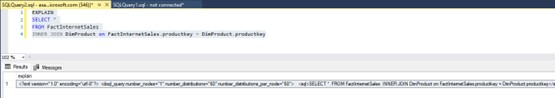
This is the most detailed plan provided but may be limited by your query editor (only 4000 characters returned).  The best way around this is to leverage SQLCMD and use the following parameters:

  • -i for input file (put your query with the EXPLAIN keyword in a script file)
  • -y for variable length type display width
  • -o for output of the entire XML plan – this can be really big for complex queries, so it is best to output it to an XML file and review it in a separate text editor.

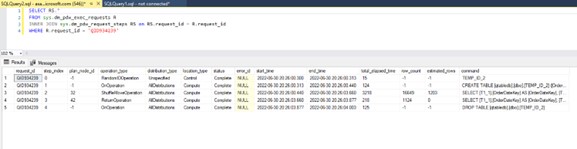
  1. After your query has executed you can check the actual query steps in DMV’s:

So now we have the dsql execution plan.  What does it mean? 

There are some immediate red flags to look out for. 

  1. Look at the cost for each operation in the XML plan or the elapsed time for each operation from the sys.dm_pdw_request_steps DMV.  The longest running or the most costly operation is where you will want to start.  Analyze the estimated number of rows compared to the actual row count of the table involved in the specific data movement operation.  If it is drastically wrong, you will want to update statistics so the Optimizer can better determine cost of moving tables and therefore move the smaller of the two datasets to complete the query.
  2. If you see long running Return operations, it likely indicates one of two issues:
    • Indexes are not optimal and therefore the final queries running on individual distributions are working against fragmented indexes.  Simply rebuild your index.
    • The client application is not able to receive the result set (think aync_network_io from SQL Server) efficiently.  This could be due to network, or could be due to memory limitations on the client machine.

The execution plans can tell you much more than just this, but those topics will be covered in later posts as we dig into actual query tuning steps.

Loading

Categories

  • Architecture Patterns
  • Fabric
  • Performance Tuning
  • Synapse
  • Top 10 Performance Considerations

Archives

  • July 2023
  • January 2023
  • December 2022
  • November 2022
  • September 2022
  • August 2022

Recent Synapse Videos

Microsoft Fabric is a SaaS platform that lets you easily connect, process, and visualize data, all within a single, secure environment. Instead of maintaining your own security infrastructure, Fabric takes care of it for you, leveraging Microsoft’s resources and expertise to keep your data protected, patched, monitored, and compliant. 

By moving your data to the cloud and working with analytics tools like Power BI, Data Factory, and the next-generation Synapse, you get built-in encryption for data at rest and in transit, along with disaster recovery options. This means you can confidently focus on building data solutions without worrying about the underlying security. 


🎙 Meet the Speakers: 

👤 Guest from Product Group: Santhosh Kumar Ravindran, Senior Product Manager 


Santhosh Ravindran currently leads Spark Compute and Settings for Microsoft Fabric Spark. He focuses on building capabilities that meet the data engineering needs like Spark Pools, Queueing and Scheduling, and Job orchestration for big data workloads in large enterprises using Spark. Prior to this, Santhosh was a Product Manager and Engineering Lead building Metadata scanners, access policy orchestration, lineage and data catalog systems for enterprise data estates as part of the Microsoft Governance Platform (Microsoft Purview). 


LinkedIn:  https://www.linkedin.com/in/thisissanthoshkumar/   

Twitter:  https://www.twitter.com/iamsanthoshkr  


👤 Host: Estera Kot, Principal Product Manager at Microsoft. 

LinkedIn: https://www.linkedin.com/in/esterakot/ 
Twitter: https://twitter.com/estera_kot 


👍 Liked this video? Don't forget to hit the 'Like' button and share it with your peers!
Microsoft Fabric Product Group presents: Security in Fabric Data Engineering
Fabric Apache Spark Diagnostic Emitter for Logs and Metrics is now in public preview. This new feature allows Apache Spark users to collect Spark logs, job events, and metrics from their Spark applications and send them to various destinations, including Azure Event Hubs, Azure Storage, and Azure Log Analytics. It provides robust support for monitoring and troubleshooting Spark applications, enhancing your visibility into application performance. 

 What Does the Diagnostic Emitter Do? 

The Fabric Apache Spark Diagnostic Emitter enables Apache Spark applications to emit critical logs and metrics that can be used for real-time monitoring, analysis, and troubleshooting. Whether you’re sending logs to Azure Event Hubs, Azure Storage, or Azure Log Analytics, this emitter simplifies the process, allowing you to collect data seamlessly and store it in your preferred destinations.  


Blog post: https://blog.fabric.microsoft.com/en-US/blog/announcing-the-fabric-apache-spark-diagnostic-emitter-collect-logs-and-metrics/  


🎙 Meet the Speakers: 

👤 Guest Expert: Jenny Jiang, Principal Product Manager | Fabric Data Engineering 

LinkedIn: https://www.linkedin.com/in/jenny-jiang-8b57036/ 

👤 Host: Estera Kot, PhD, Principal Product Manager at Microsoft. 

LinkedIn: https://www.linkedin.com/in/esterakot/ 

Twitter: https://twitter.com/estera_kot 

👍 Liked this video? Don't forget to hit the 'Like' button and share it with your peers!
Microsoft Fabric Spark Diagnostic Emitter for Logs and Metrics
The T-SQL notebook feature in Microsoft Fabric lets you write and run T-SQL code within a notebook. You can use T-SQL notebooks to manage complex queries and write better markdown documentation. It also allows direct execution of T-SQL on connected warehouse or SQL analytics endpoint. By adding a Data Warehouse or SQL analytics endpoint to a notebook, T-SQL developers can run queries directly on the connected endpoint. BI analysts can also perform cross-database queries to gather insights from multiple warehouses and SQL analytics endpoints. 

🎙 Meet the Speakers: 

👤 Guest from Microsoft Fabric Product Group: Qixiao Wang, Principal Program Manager in Microsoft | Fabric Spark 

Linkedin: https://www.linkedin.com/in/%E5%90%AF%E9%9C%84-%E7%8E%8B-24368233/  


👤 Host: Estera Kot, Principal Product Manager at Microsoft. 

LinkedIn: https://www.linkedin.com/in/esterakot/ 
Twitter: https://twitter.com/estera_kot 


👍 Like this video? Don't forget to hit the 'Like' button and share it with your network! 

🔔 Stay Updated: For more insights into Microsoft Fabric Data Engineering and Data Science, and all things tech, make sure to subscribe to our channel and hit the notification bell so you never miss an episode!
Microsoft Fabric Product Group presents T-SQL support in Microsoft Fabric Notebooks
AutoML (Automated Machine Learning) is a collection of methods and tools that automate machine learning model training and optimization with little human involvement. The aim of AutoML is to simplify and speed up the process of choosing the best machine learning model and hyperparameters for a given dataset, which usually demands much skill and computing power. 


🎙 Meet the Speakers: 

👤 Guest from Microsoft Fabric Product Group: Misha Desai, Senior Program Manager  


Misha is a Senior Product Manager based in Seattle, WA, specializing in model tracking, training, and governance within the Fabric Data Science team. 

Linkedin: www.linkedin.com/in/misha-desai-6034a362 


👤 Host: Estera Kot, Senior Product Manager at Microsoft and a member of the Fabric Product Group. She holds the role of Product Owner for Apache Spark-based runtimes in Microsoft Fabric and Synapse Analytics. Estera is a Data & AI Architect and is passionate about computer science. 
LinkedIn: https://www.linkedin.com/in/esterakot/ 
Twitter: https://twitter.com/estera_kot 

🔔 Stay Updated: For more insights into Microsoft Fabric Data Engineering and Data Science, and all things tech, make sure to subscribe to our channel and hit the notification bell so you never miss an episode!
Low Code AutoML UI in Microsoft Fabric Data Science
With high concurrency mode, we’re bringing a game-changing way to orchestrate your data ingestion and transformation processes in enterprise workflows. Notebooks in pipelines now leverage shared, high-performance sessions, combining speed with cost-efficiency—all while maintaining top-tier security. 

 Imagine a pipeline with five notebooks, each running 5 minutes. Normally, the 3-minute Spark start time per step would push your pipeline to 40 minutes. With high concurrency, the total runtime drops to 28 minutes—a 30% speed improvement. 

Unlock faster workflows, lower costs, and a seamless data journey with high concurrency mode. Get ready to experience the next level of pipeline orchestration! 🎉 

https://blog.fabric.microsoft.com/en-US/blog/introducing-high-concurrency-mode-for-notebooks-in-pipelines-for-fabric-spark/  

🎙 Meet the Speakers: 

👤 Guest from Product Group: Santhosh Kumar Ravindran, Senior Product Manager 


Santhosh Ravindran currently leads Spark Compute and Settings for Microsoft Fabric Spark. He focuses on building capabilities that meet the data engineering needs like Spark Pools, Queueing and Scheduling, and Job orchestration for big data workloads in large enterprises using Spark. Prior to this, Santhosh was a Product Manager and Engineering Lead building Metadata scanners, access policy orchestration, lineage and data catalog systems for enterprise data estates as part of the Microsoft Governance Platform (Microsoft Purview). 


LinkedIn:  https://www.linkedin.com/in/thisissanthoshkumar/   

Twitter:  https://www.twitter.com/iamsanthoshkr  


👤 Host: Estera Kot, Principal Product Manager at Microsoft. 

LinkedIn: https://www.linkedin.com/in/esterakot/ 
Twitter: https://twitter.com/estera_kot 


👍 Liked this video? Don't forget to hit the 'Like' button and share it with your peers!
High Concurrency Mode for Notebooks in Pipelines for Fabric Spark
Load More... Subscribe